U.S. COVID Infection Rates Shown in Updated CDC Map
Submitted by mike kraft on
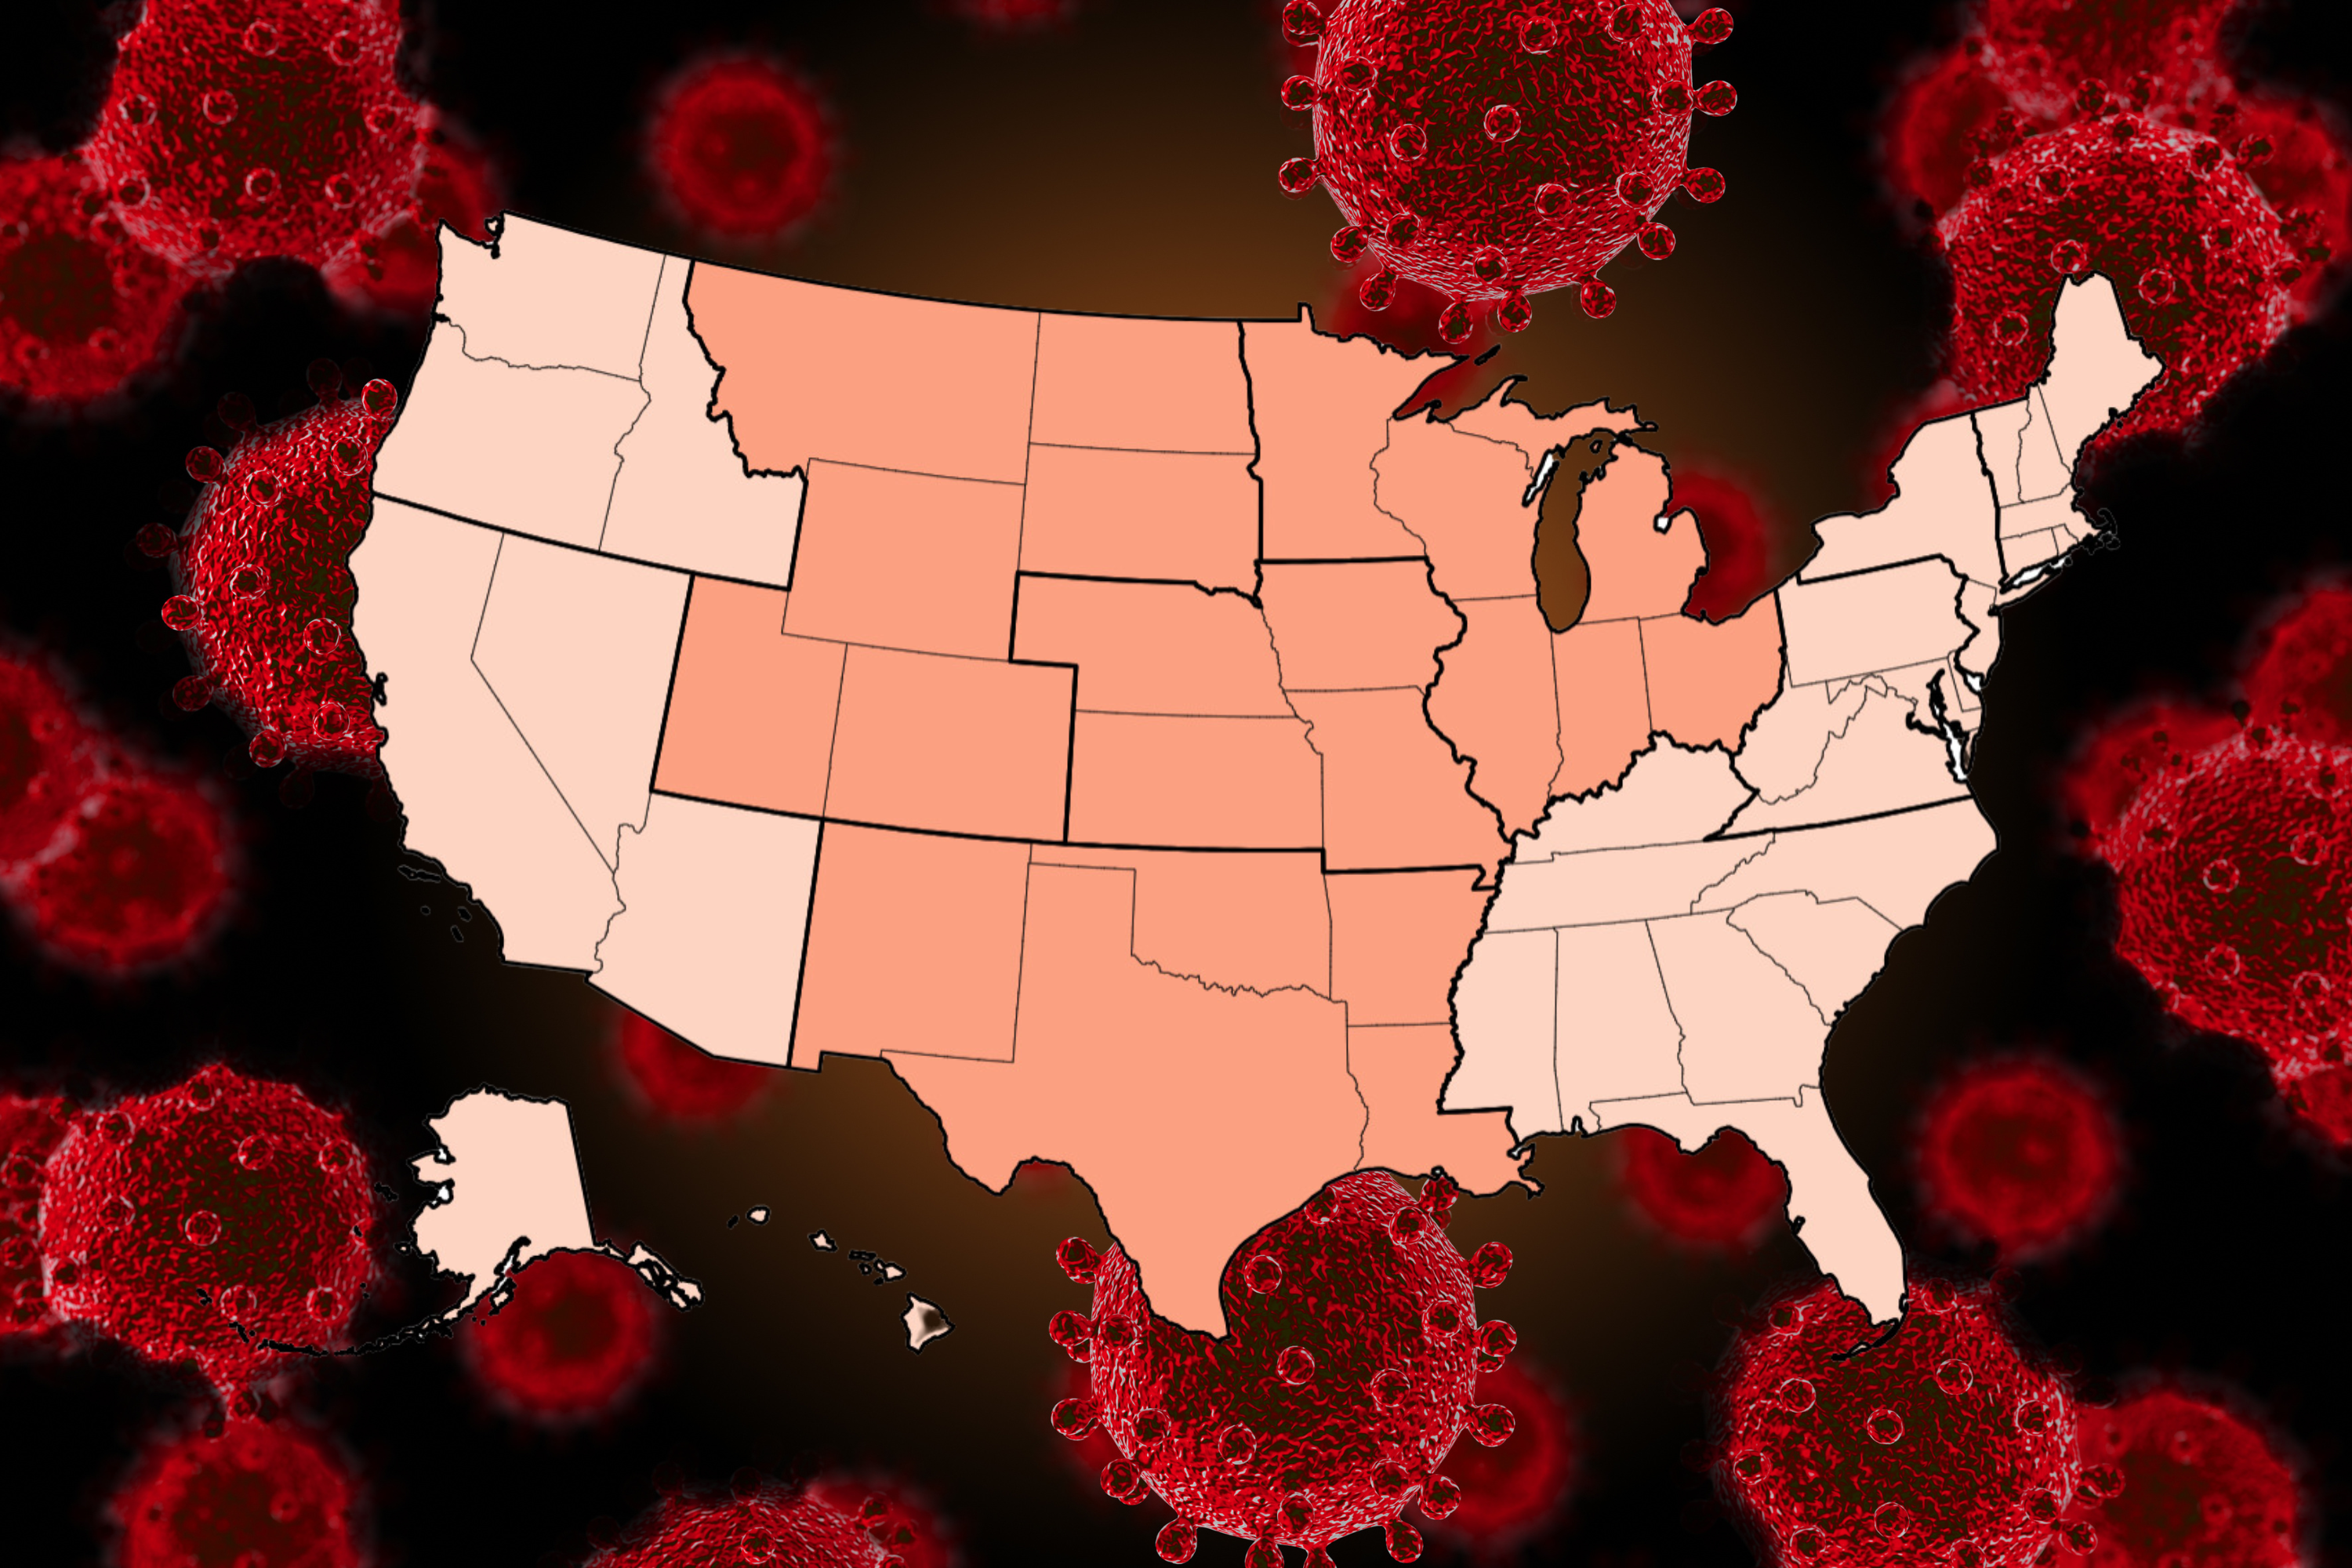
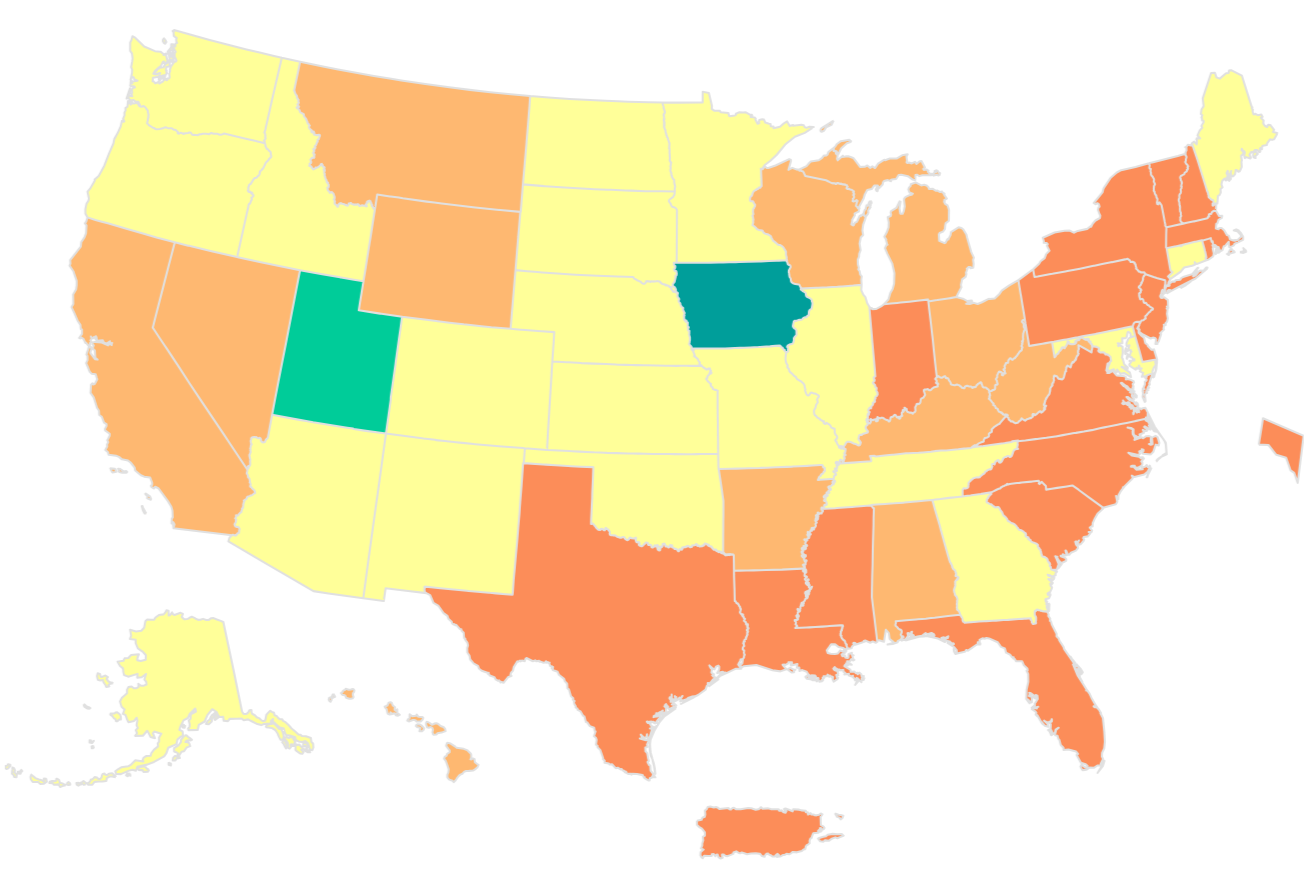
 COVID: Updated CDC map reveals infection rates across US The latest data reveals that COVID-19 rates are rising in the U.S. compared to the previous week. Newsweek
 The percentage of emergency department visits that were diagnosed as COVID has remained largely unchanged in recent weeks, at 0.6 percent—with the highest rates located in the Southwest: New Mexico at 1.8 percent and Arizona at 1.5 percent.
Deaths from COVID are highest in North Carolina, with 1.4 percent of deaths attributed to the virus.
California, Michigan, New York and Florida also have higher than average rates of COVID-related deaths, ranging from 1.2 percent in California to 0.6 percent in Florida.
...
- Read more about U.S. COVID Infection Rates Shown in Updated CDC Map


- Log in or register to post comments


